地球の水素のハローEarth's hydrogen halo
データ:NASA/Carruthers Geocorona Observatory(PI:L. Waldrop、UIUC)/恒星:ESA Gaia、Hipparcos、Tycho-2(AT-HYG)/画像処理:Stefano Ivan StingaNASA/Carruthers Geocorona Observatory (PI L. Waldrop, UIUC) · Stars: ESA Gaia, Hipparcos, Tycho-2 via AT-HYG · Processing: Stefano Ivan Stinga
ダウンロードDownloads
文字なし版をお使いの場合は、上記のクレジットを近くに表記してください。With the clean version, please print the credit above near the picture.
解説
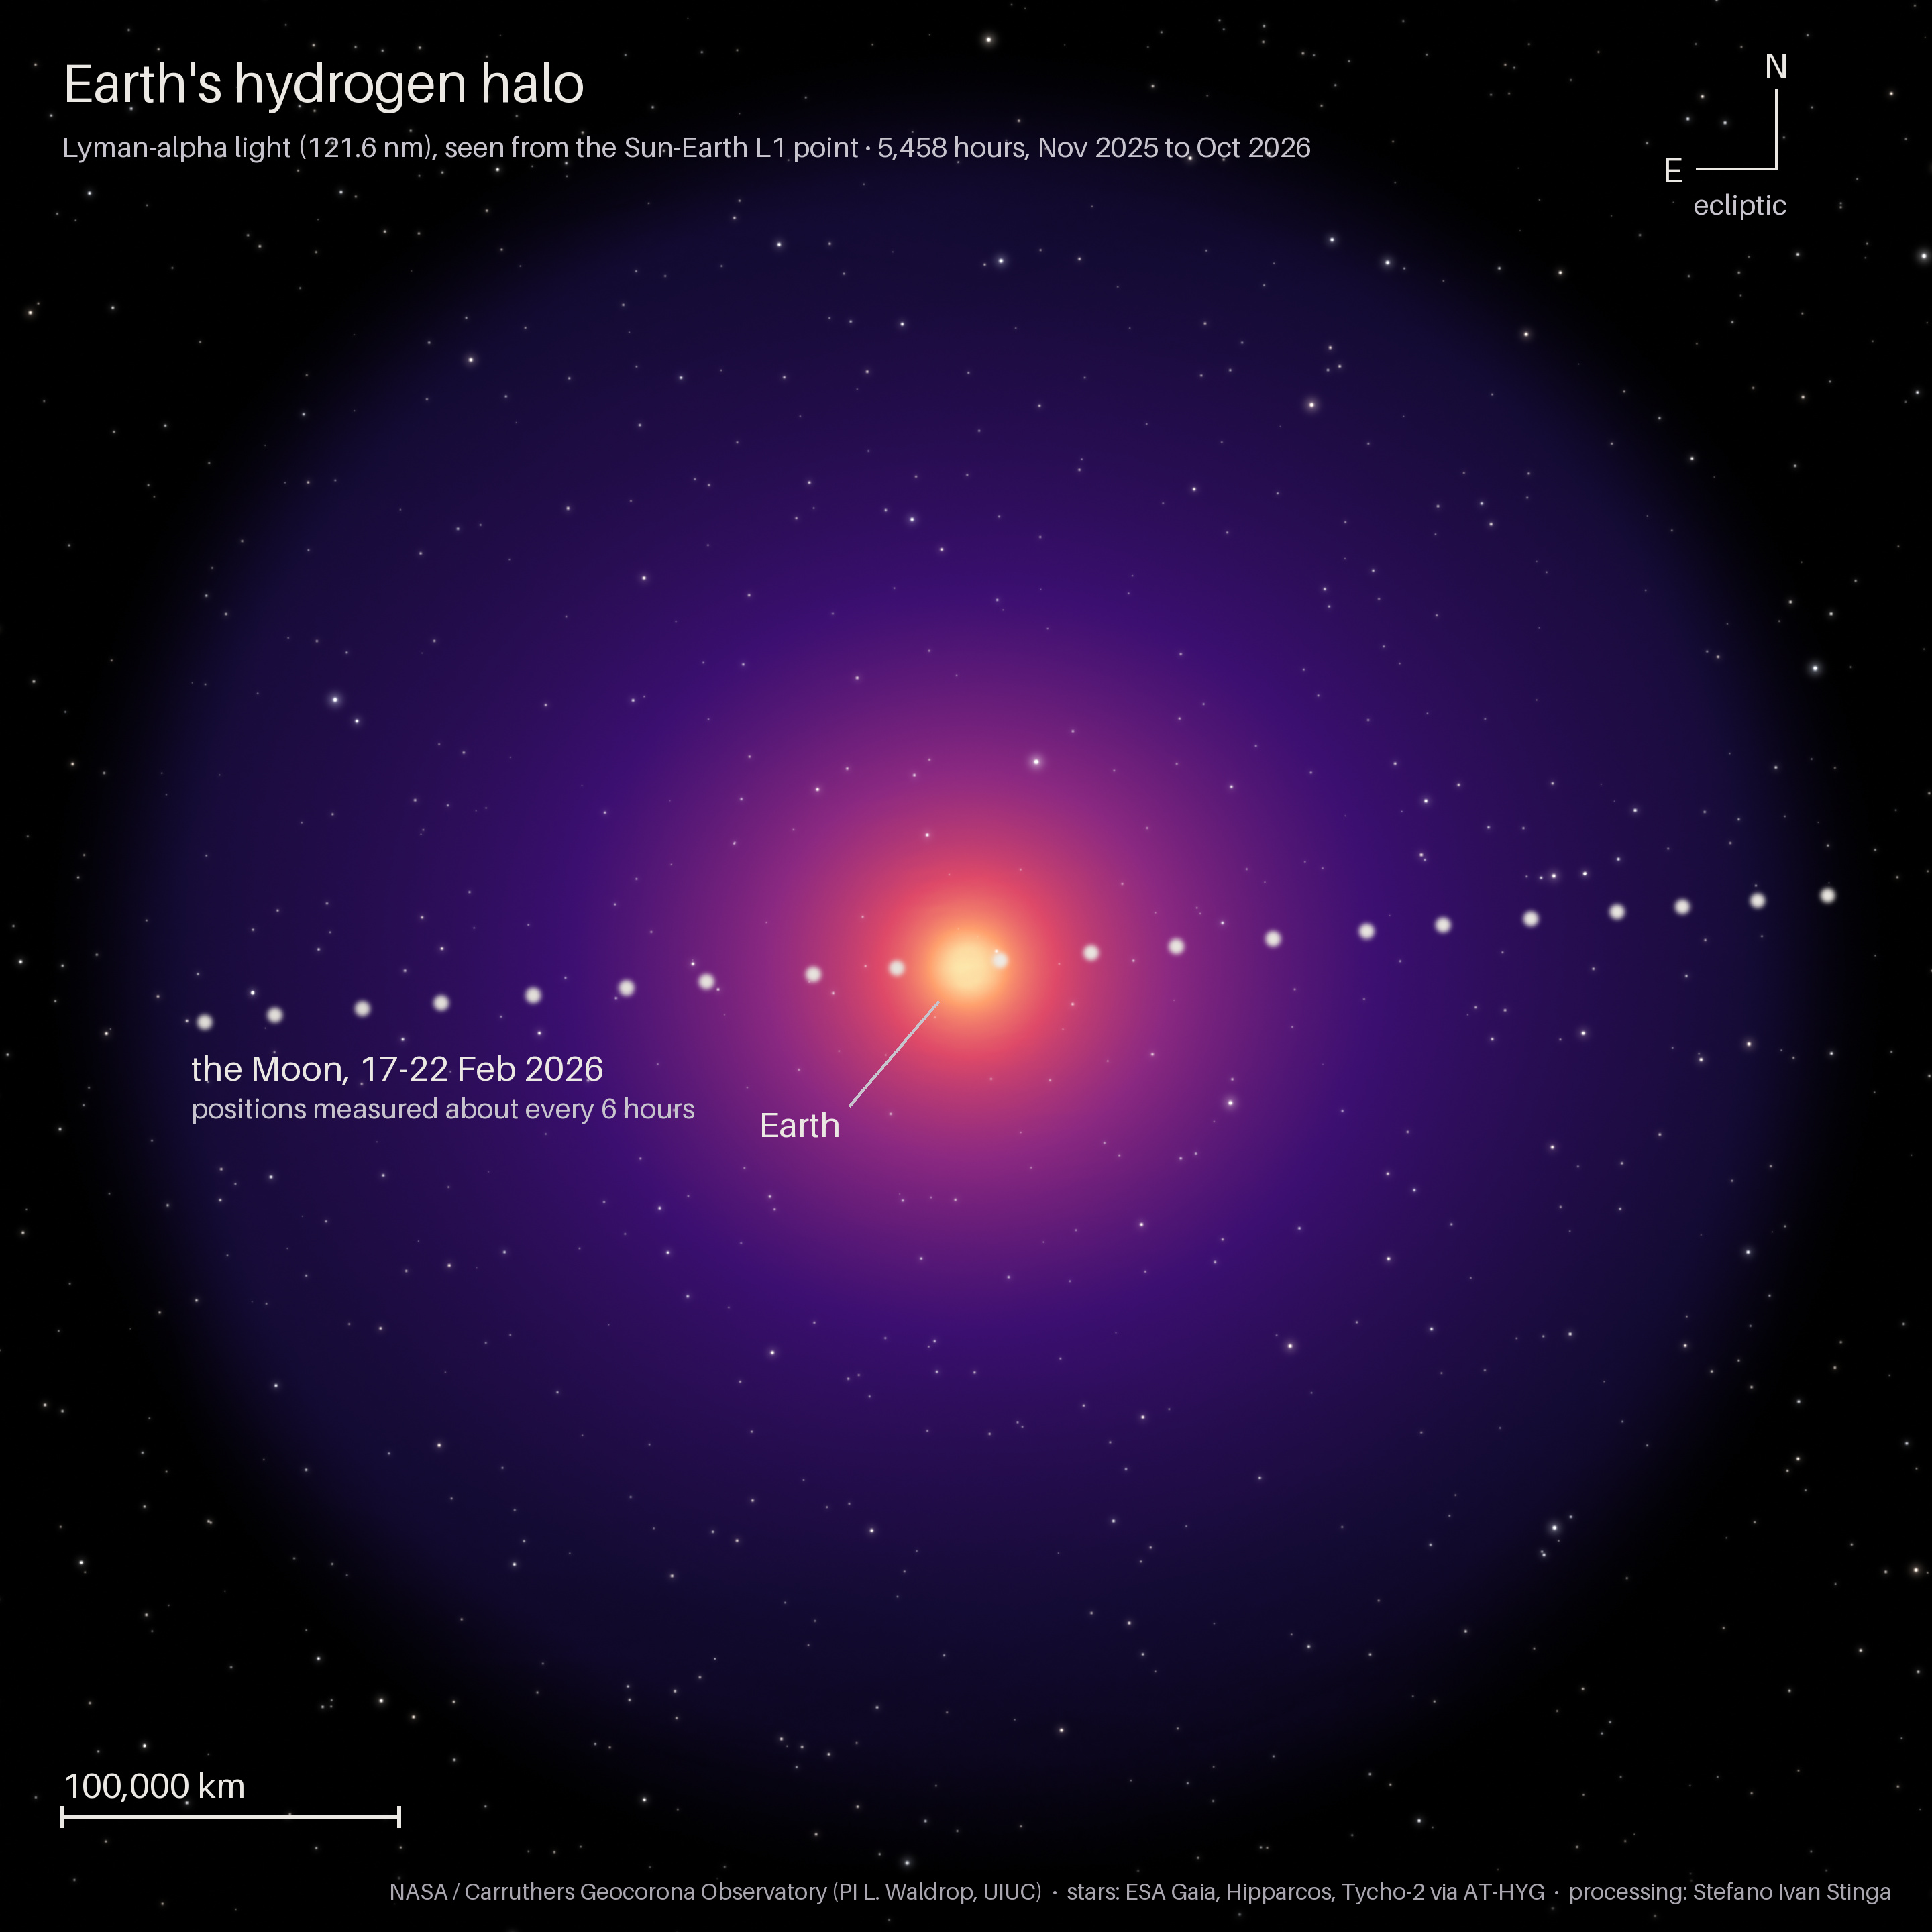
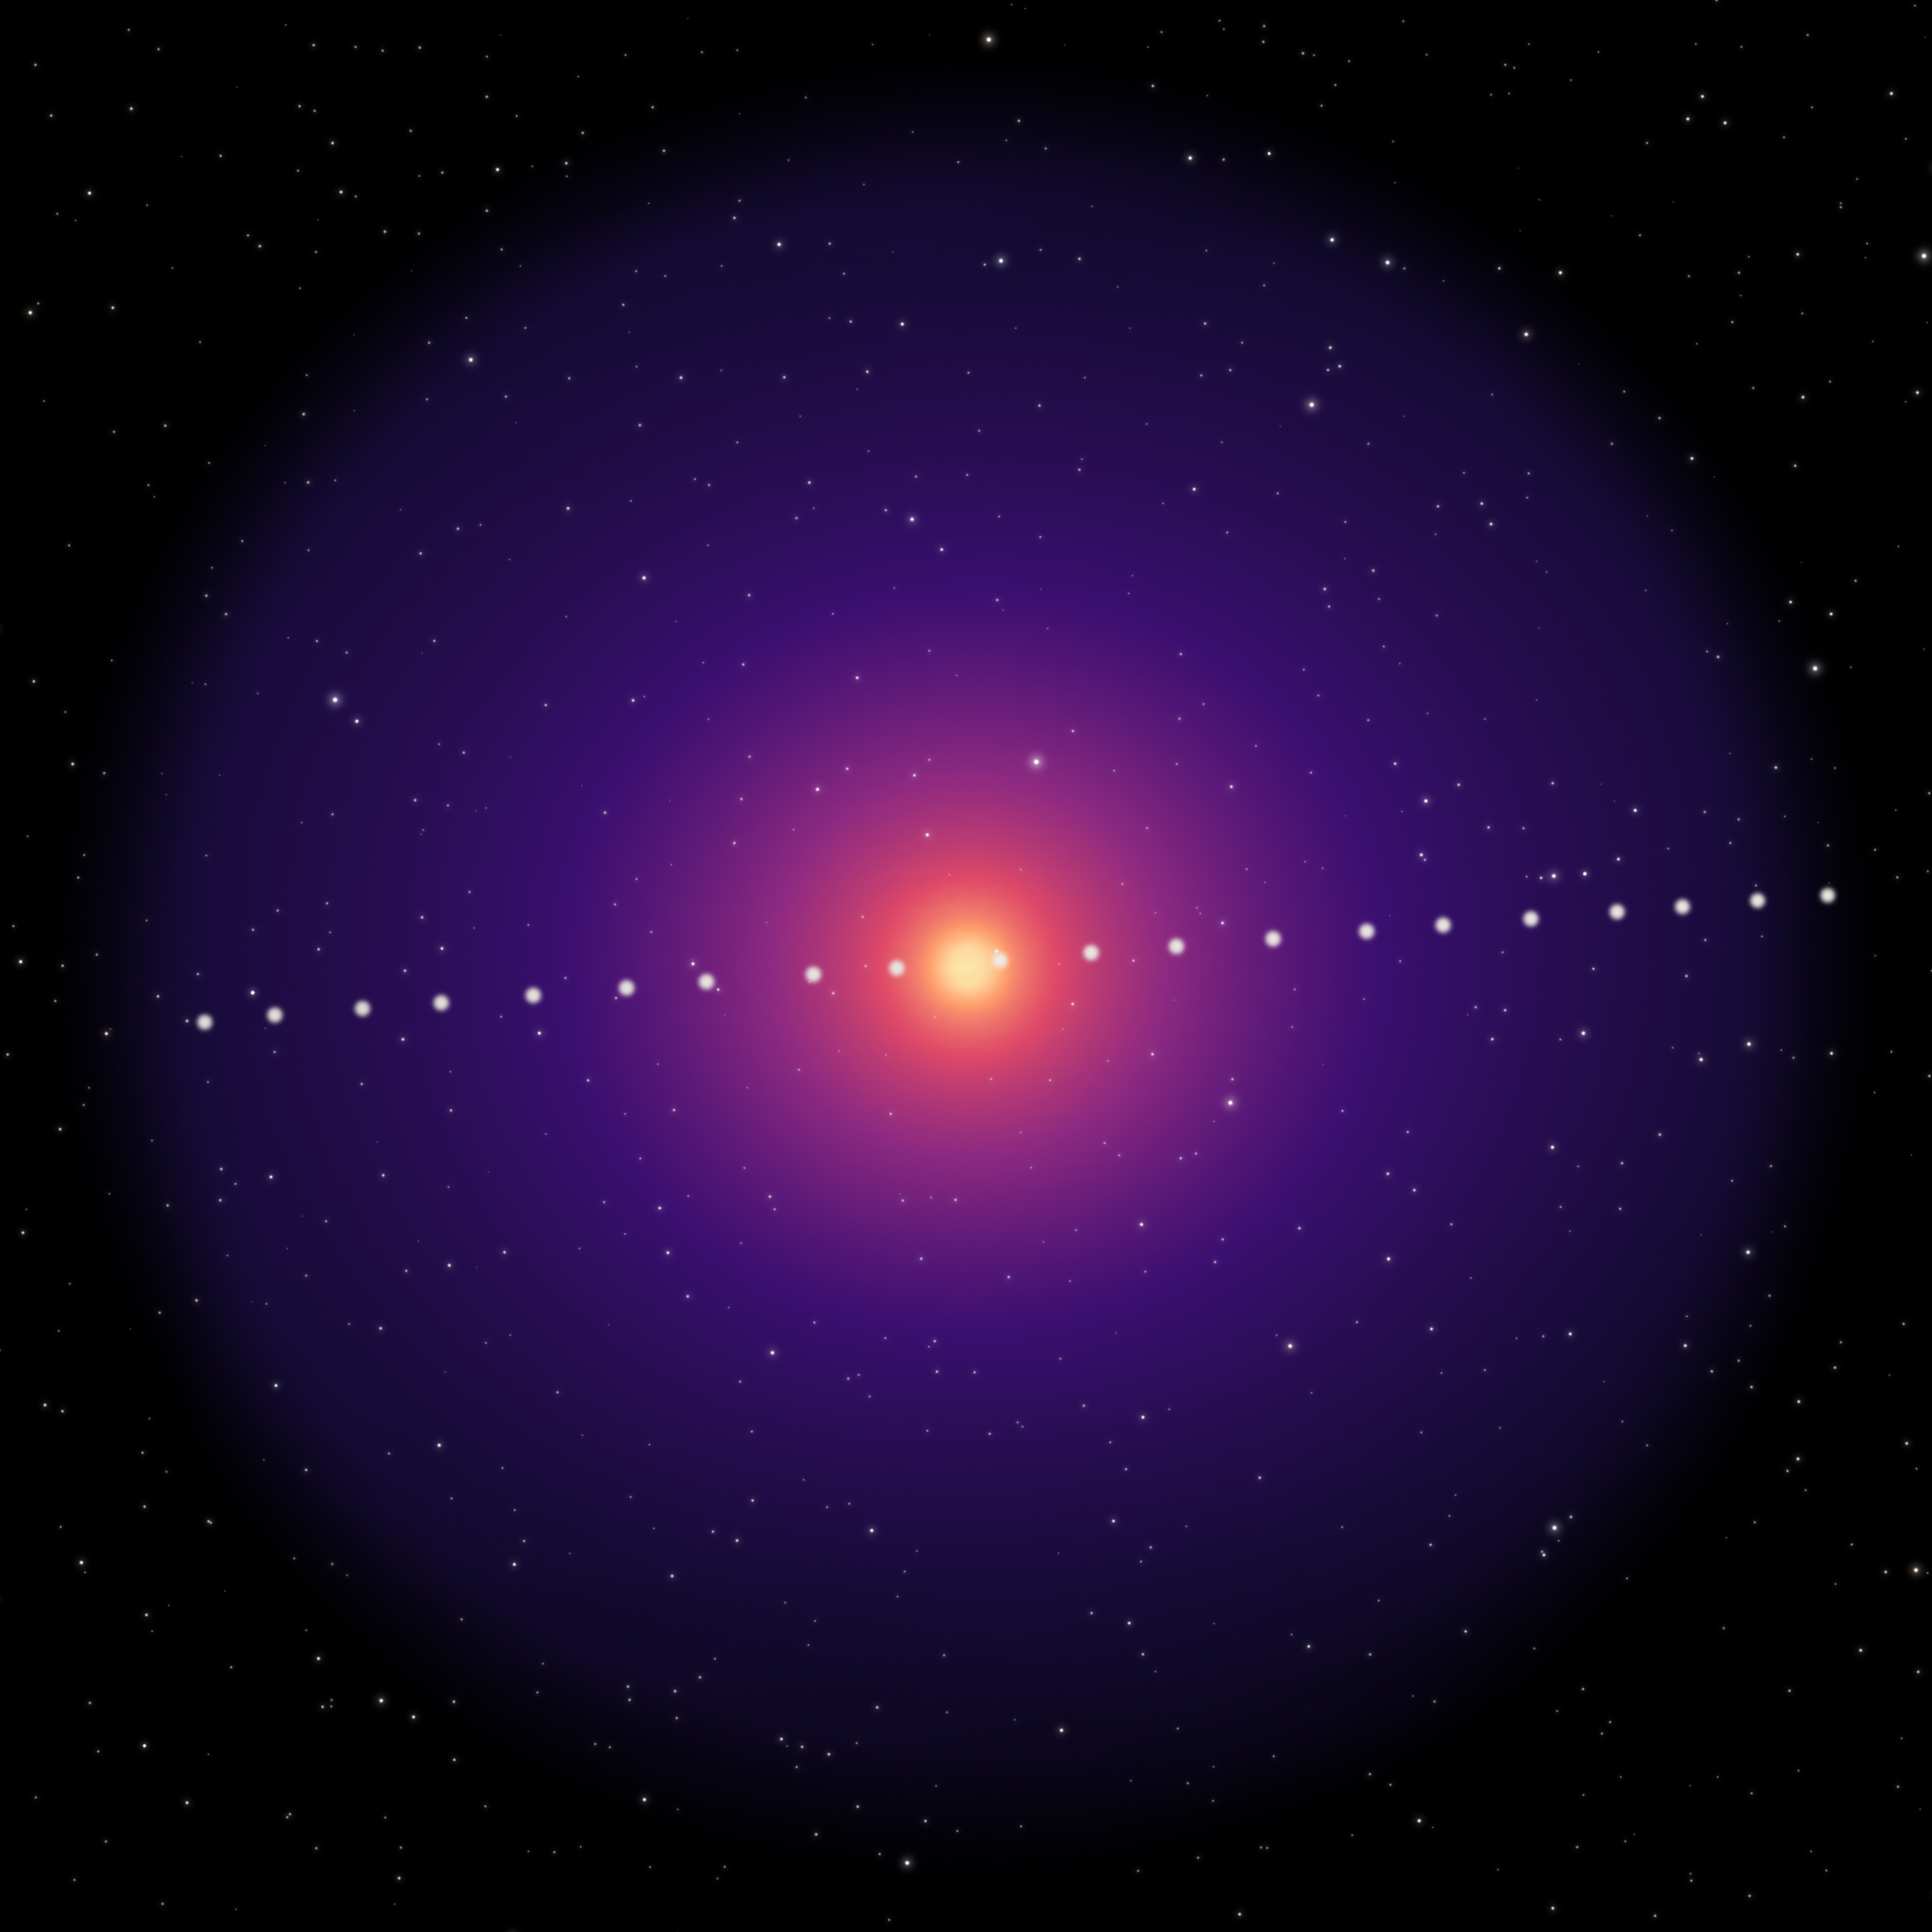
地球の大気のいちばん外側、外気圏は、水素原子の巨大な雲で、紫外線のライマンα線(波長121.6ナノメートル)で淡く光っています。地上からは見えないこの光を、NASAのカラザース・ジオコロナ観測衛星(Carruthers Geocorona Observatory)が、太陽と地球のラグランジュ点L1の近く、地球から約150万kmの位置から観測しています。この画像は、2025年11月から2026年10月までに撮られた5,790枚、合計5,458時間分の画像を重ねたものです。写野は約57万km、黄道の北が上です。光は、データのある約27万km先までたどれ、さらに外へ続いています。
月は、2026年2月17〜22日に地球の前を横切ったときの20か所の位置を、約6時間ごとに示しています。位置、大きさ、明るさはカラザースの画像で測ったもので、1時間露出による動きのぶれは描いていません。星は星表(Gaia、Hipparcos、Tycho-2)から、月が地球の前を通過した2026年2月19日16時14分(世界時)に地球の背後にあった位置に置いています。カラザース自身に写る星は、遠紫外線で明るいごく一部だけです。
色の意味
- 紫外線の明るさを、対数スケールの疑似カラーで表しています:暗いところは濃い紫、明るくなるにつれてマゼンタ、オレンジ、地球のまわりは淡い黄色
- 月はやわらかなグレー、星は色指数(B−V)に応じて控えめに色付けしています
- 肉眼で見える色ではありません(ライマンα線は人の目には見えません)
作り方
- データ:カラザースの広視野カメラ(WFI、視野18度)のレベル0データ(doi:10.48322/2tde-1r42)、NASA宇宙物理データ施設(SPDF)から
- 1枚ずつ較正:マスク行による読み出しのずれ、同じ日の遮光画像によるダーク、チームの較正値による1分あたりの光子数への変換。地球から20度以上離れた685枚でフラットを作成。列状の縞と、地球と同じ検出器の行に出る淡い帯を除去し、検出器の欠陥、星、月をマスク
- 衛星の位置と姿勢から、すべての画像を地球中心・地球半径単位・黄道の北が上の共通の格子に配置(地球の中心は1枚ずつ測定)
- 惑星間空間の水素の淡い光を、全画像に共通するハローのモデルと一緒に1枚ずつ当てはめて除去。ゼロ点は、ハロー自身の距離による減り方(およそ r−2.07)から決めています
- 露出時間で重み付けして合成。外れ値の除去は、マスクの後ではほとんど何も取り除きませんでした
- 見た目:明るさは1分・1ピクセルあたり0.2〜700光子の対数、「magma」風のカラーマップ。データの途切れる約43地球半径でやわらかく暗くしています
- 月:2026年2月17〜22日の約6時間ごとの20枚で、それぞれ中心と明るさを測定(重ねたハローを差し引いて)。その時刻の実際の大きさの円盤として描き、カメラの解像度に合わせてぼかしています
- 星:AT-HYG v3.2 星表(David Nash/astronexus、CC BY-SA 4.0。位置と等級はESA Gaia DR3、Hipparcos、Tycho-2)の11等までの924個。固有運動を2026年2月まで進め、通過時刻のカラザースの位置から投影。大きさと明るさは等級、色はB−Vから。地球の円盤の後ろの星は描いていません
- 自作のPythonツールで処理。処理コードはClaude(Anthropic)の支援を受けて書き、実行しました。作業の方針と結果の確認は私が行っています
注記
- 重ね合わせと合成の画像です:ハローは5,458時間分のデータ、月は20枚の画像の測定、星は星表から。
- 上記の星と月の円盤のほかは、描き加えていません。AIによる生成はしていません。
- データの出典(DOI)と謝辞は、ページの最後にあります。
About this image
Earth's outermost atmosphere, the exosphere, is a vast cloud of hydrogen atoms that glows faintly in ultraviolet Lyman-alpha light (121.6 nm). This glow can't be seen from the ground. NASA's Carruthers Geocorona Observatory watches it from about 1.5 million km away, near the Sun-Earth L1 point. This picture stacks 5,790 of its exposures, 5,458 hours in all, taken between November 2025 and October 2026. The frame is about 570,000 km across, with ecliptic north up. The glow is traced to about 270,000 km from Earth, where the data end, and it continues beyond.
The Moon is shown at 20 positions, about every 6 hours, as it passed in front of Earth on 17–22 February 2026. Its positions, size and brightness were measured in Carruthers frames; it is drawn without the motion blur of the hour-long exposures. The stars come from star catalogs (Gaia, Hipparcos, Tycho-2), placed where they stood behind Earth at the moment of the transit, 19 February 2026, 16:14 UT. Carruthers itself sees only a few far-ultraviolet stars.
What the colors mean
- The ultraviolet brightness is shown in false color on a logarithmic scale: deep violet where it is faint, then magenta and orange, and pale yellow around Earth
- The Moon is a soft gray; the stars are gently colored by their color index (B−V)
- These are not colors the eye could see: Lyman-alpha light is invisible to us
How it was made
- Data: Carruthers Level 0 files from the Wide Field Imager (18° field), doi:10.48322/2tde-1r42, from NASA's Space Physics Data Facility
- Each image calibrated: readout offsets from the masked rows, dark from the closed-filter images of the same day, conversion to photons per minute with the team's calibration. Flat field from 685 images pointed at least 20° away from Earth. Column stripes and a faint band along Earth's own detector rows removed; detector defects, stars and the Moon masked
- Every image placed on a common grid centered on Earth, in Earth radii, ecliptic north up, from the spacecraft's position and attitude (Earth's center measured in each image)
- The faint glow of interplanetary hydrogen fitted image by image, together with one halo model shared by all images, and removed. The zero level follows the halo's own fall-off with distance (about r−2.07)
- Stacked by exposure time; after the masks, outlier rejection removed almost nothing
- Look: logarithmic brightness from 0.2 to 700 photons per minute per pixel, a "magma"-style color map, and a soft fade where the data coverage ends (about 43 Earth radii)
- Moon: 20 frames of 17–22 February 2026, about every 6 hours; center and brightness measured in each (frame minus the stacked halo); drawn as a disk of its true size at that moment, softened to the camera's resolution
- Stars: AT-HYG v3.2 catalog (David Nash / astronexus, CC BY-SA 4.0; positions and magnitudes from ESA Gaia DR3, Hipparcos and Tycho-2), 924 stars to magnitude 11, proper motion applied to February 2026, projected from Carruthers' position at the transit; size and brightness by magnitude, gentle color by B−V. Stars behind Earth's disk are left out
- Processed with my own Python tools. The processing code was written, and the processing was run, with the assistance of Claude (Anthropic); I directed the work and checked the results
Notes
- This is a stack and a composite: the halo from 5,458 hours of data, the Moon from measurements in 20 frames, the stars from catalogs.
- Apart from the catalog stars and the Moon disks described above, nothing was added. Nothing was generated with AI.
- The data references (DOIs) and acknowledgments are at the end of this page.
利用についてUse
報道・記事でのご利用は、上記のクレジットを表記いただければご自由にどうぞ。それ以外のご利用は CC BY-SA 4.0 の条件に従ってください。News and editorial use is welcome with the credit above. Other uses: CC BY-SA 4.0.
連絡先Contact: [email protected] · X: @Sting1_JP